![]() Table
Editor
Table
Editor
Editing Tables
Table modification is one of the main operations that you will use to modify your tune. Understanding the table display layout and functionality will help make your table editing easier.
Hotkeys:
| +/- | Increment and decrement value(s) |
| CNTRL+C | Copy value(s) |
| CNTRL+V | Paste value(s) |
| CNTRL+Z | Undo last modification |
Copy with Labels (right click menu)
This function is available in VCM Editors Table Editor, VCM Scanners Histogram Display, and VCM Scanners RTT Editor.
Paste Special (right click menu)
When using the VCM Scanner histograms properly, you can easily import the learned histogram data into VCM Editor using the paste special feature of the table editor.| Add | Add the contents of the clipboard to the table |
| Subtract | Subtract the contents of the clipboard from the table |
| Multiply % | Multiply the contents of the table by the clipboard values as a percentage |
| Multiply % - Half | Multiply the contents of the table by the clipboard values as a percentage divided in half |
| Average | Average the values between the clipboard and the table |
Understanding the Toolbar
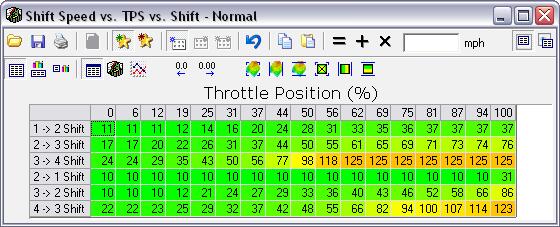
Table Open, Save and Print
| Import a table from a file and overwrite current table. | |
| Save the table to a file. | |
| Print the table. |
| Add this table to the favorites. | |
| Remove this table from the favorites. |
| View the table for the primary calibration | |
| View the table for the compare calibration | |
| View the differences between the primary and compare calibrations |
| Reload the current table |
| Copy table selection to clipboard | |
| Paste table selection from clipboard |
| Replace selected cells with the value in the box | |
| Add the value in the box to the selected cells | |
| Multiply the selected cells by the value in the box |
| View only 1 data representation (table or 2D/3D graph) | |
| Use a horizontal split with the table display on the bottom and the graph up top | |
| Use a vertical split with the table display on the left and the graph on the right |
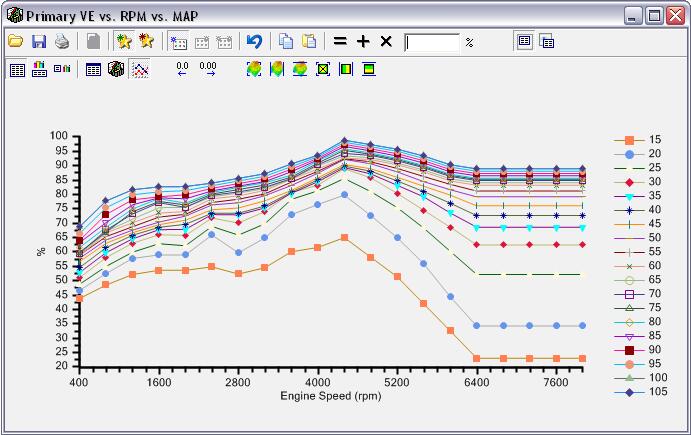
| View the table data representation | |
| View the 2D chart data representation | |
| View the 3D chart data representation |
| Decrease decimal precision | |
| Increase decimal precision |
| Smooth the entire selection | |
| Smooth the selection only using a horizontal pass | |
| Smooth the selection only using a vertical pass | |
| When using the smoothing functions, the level of smoothing will be determined by your current precision. To increase the effected area of your smoothing, increase your precision. | |
| Interpolate the entire selection (flat plane) | |
| Interpolate between horizontal bounds (creates lines) | |
| Interpolate between vertical bounds (creates lines) |
Using the 3D View

You can control the rotation, shift, zoom of the 3D graph as well
as modify data points with the left mouse button.
Using the 2D View